CBP 2017 Apprehensions May Be Historic, But They Are Not Dramatic
Share
Share
Apprehensions at the U.S.-Mexico border dropped to historic lows in FY2017 even as they began rising again in late FY2017 and early FY2018 due to a rise in unaccompanied children (UACs) and family unit apprehensions. The overall drop in apprehensions at the Southwest border and cases of persons denied admission at U.S ports of entry led U.S. Customs and Border Protection (CBP) to declare in its Border Security Report Fiscal Year 2017 that 2017 saw the “lowest level of illegal cross-border migration on record.” Although these figures are significant, our review of annual and monthly CBP data from FY1960 to FY2017 shows that the 2017 Southwest border apprehension figures align with a significant decrease in apprehensions since 2005, and 2017 does represent a low in CBP’s apprehensions during this period. However, CBP’s claim about overall migration based on these data renews questions about which metrics can effectively track illegal cross-border migration and assess CBP’s enforcement measures.
In FY2017, CBP recorded 310,531 apprehensions, with 303,916 occurring at the Southwest border. As Figure 1 shows, the FY2017 Southwest border apprehension figures are historically low, especially when compared to the peak years of the early 1980s and mid- to late-1990s, or more recently, FY2014 and FY2016, when large numbers of UACs arrived at the border. However, the FY2017 numbers are comparable to the apprehension numbers seen in FY2011 and FY2015 when apprehensions were 327,577 and 331,333, respectively.
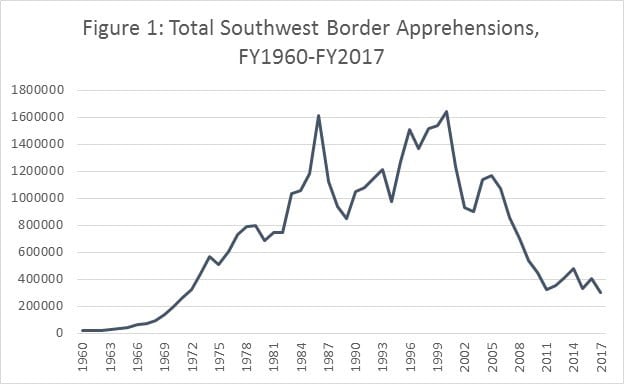
More importantly, the FY2017 Southwest apprehension figures represent the continuation of a downward trend in total apprehensions along the U.S.-Mexico border that began in the mid-2000s. As Figure 1 shows, apprehension numbers began to drop significantly after FY2005, with apprehensions falling below 1 million since FY2007, and under 500,000 since FY2010. Post-FY2005 rates are largely similar to those seen between FY1960 and FY1982, when apprehensions consistently remained under 1 million. Factors such as improved border security efforts, the impact of the economic recession on immigration flows, and a drop in Mexican migration and apprehensions drove this decline. While FY2014 and FY2016 saw increases due to the arrival of UACs from Central America, the overall decline in apprehensions continued in FY2017.
The FY2017 Southwest border apprehension figures also confirm recent demographic shifts in illegal immigration that have impacted the reduction in apprehension figures since 2005. As Figure 2 shows, individuals from Central America have mostly replaced Mexicans as the largest group of individuals apprehended at the U.S.-Mexico border?especially in in FY2014, FY2016, and FY2017 when UACs and family units began crossing the U.S.-Mexico border in greater numbers.
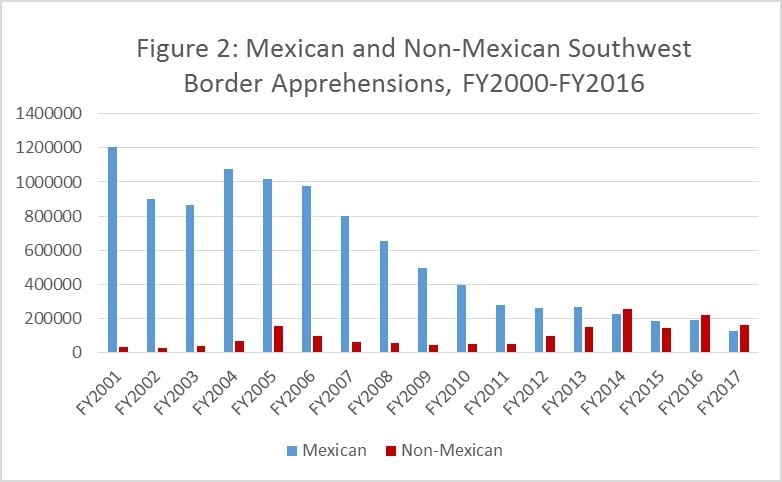
The FY2017 figures show that the number of Mexicans apprehended at the border remains historically low, especially when compared to the peak set in FY2001. As Figure 2 shows, CBP apprehended fewer than 1 million Mexicans starting in FY2006 and fewer than 500,000 starting in FY2009. In addition to the economic and security factors noted above, the aging of the Mexican population and declining birthrates shrunk the population of people in Mexico ages 15 to 29, the prime age group for emigration to the United States. Even though apprehensions of individuals from Central America has trended upward since FY2012, it has not offset the declines in Mexican arrests to bring overall apprehensions to past highs seen throughout the 1990s and earlier 2000s.
The agency’s monthly apprehension figures for FY2017 and the first two months of FY2018 largely align with the broader trend seen since 2005. As Figure 3 shows, the number of apprehensions dropped off significantly through April 2017 before rising in May, a trend that has continued into FY2018.
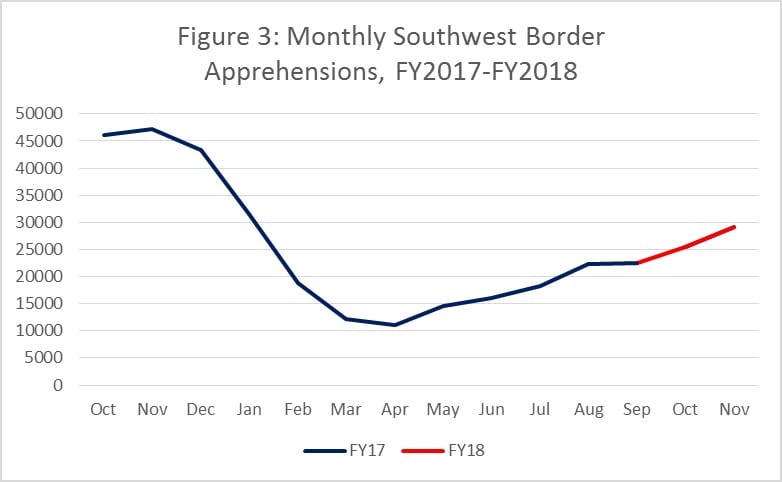
The month-to-month increase in the number of UACs and family units accounts for the rise in apprehension in the last few months. In April 2017, CBP apprehended 997 UACs and 1,118 family units; these numbers increased to 4,000 and 7,018 in November 2017. Furthermore, following a large surge of Central Americans attempting to cross the border before the start of the Trump administration between October and January, and a significant drop-off between January and April 2017, the UAC and Family numbers rebounded in May and are now largely back to previous levels.
The increase in the monthly apprehension numbers from late FY2017 and early FY2018 align with those seen over the last five years. As Figure 4 shows, the apprehension numbers in mid-2017 were significantly lower than in the last five years, especially compared to FY2014 which had large numbers of UACs and family units crossing the border. However, apprehension figures from October to December FY2017 as well as August to September FY2016 were higher or comparable to other years:
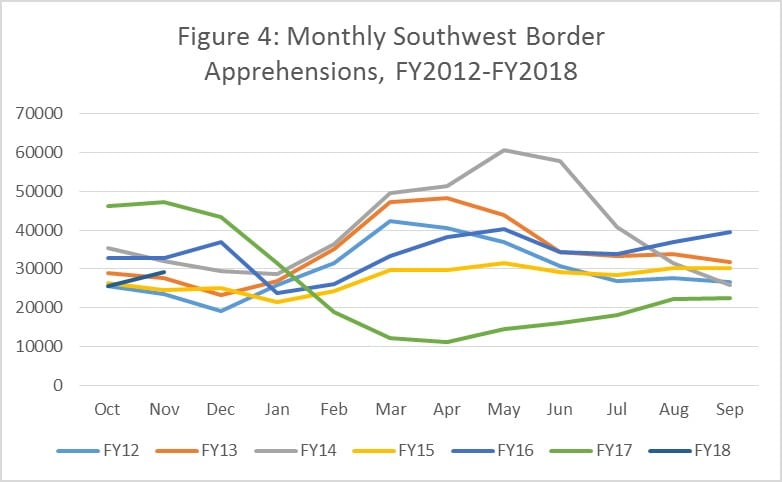
The early FY2018 figures show that the continued increase in apprehensions may reach similar levels seen in other years, with November 2018 hitting levels seen in November 2013. While it is too early to determine whether FY2018 will see a jump in apprehensions, these new monthly figures suggest that Southwest border apprehensions will largely revert to numbers seen since 2012, marking FY2017 as the lower bound of a longer-term drop in apprehensions since 2005.
While the apprehension number largely mark existing trends, they also raise long-standing questions about which border metrics can effectively measure illegal entries along the border. As we have noted in previous analyses, apprehensions or arrests simply measure those who were unsuccessful in their illegal entry attempt, making an insufficient metric to determine the rate of unauthorized cross-border migration. If CBP wants to support broader claims about illegal cross-border traffic, it needs to track, gather, and calculate other data such as probability of apprehension at the border to complement existing data sets. Encouragingly, the Department of Homeland Security (DHS) recently published draft estimates of these probability figures and levels of successful attempts, similar to the metrics we suggested in our work. While these initial estimates strongly indicate that increased enforcement has resulted in fewer successful illegal entries, DHS should continue to develop and publish these metrics to provide legislators and the public with a better assessment of CBP’s border enforcement strategies and illegal migration along the border.
Share
Read Next
Support Research Like This
With your support, BPC can continue to fund important research like this by combining the best ideas from both parties to promote health, security, and opportunity for all Americans.
Give NowRelated Articles
Join Our Mailing List
BPC drives principled and politically viable policy solutions through the power of rigorous analysis, painstaking negotiation, and aggressive advocacy.