Current State of U.S.-Mexico Border Infrastructure: February 2019
Share
Share
Despite widespread perception of a lack of security at the U.S. southwest border, the United States has steadily increased its enforcement presence at the border over the last two decades under presidents of both parties. The Trump administration has taken additional steps to increase infrastructure along the border, including increasing the number of border patrol agents and new physical barriers. This paper addresses the state of border infrastructure in January 2019 in order to ground in fact and reality the debate over the necessity of an expanded border wall and other enforcement strategies.
Border Patrol Agents
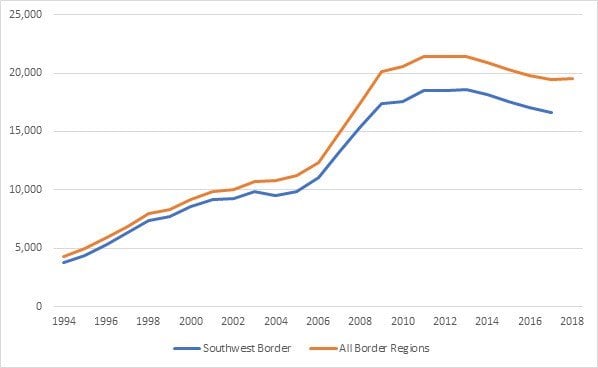
U.S. Customs and Border Protection (CBP) employed a total of 19,555 Border Patrol agents in 2018, deployed across all border regions. The agency has experienced hiring challenges in recent years but had a net gain of agents in 2018—the first in five years. The vast majority of Border Patrol agents are stationed at the U.S.-Mexico border, and all new Border Patrol agents are assigned to southern border sectors for their first assignment.
Figure 1. Border Patrol Agents, FY1994-2018
Tactical Infrastructure
The diverse material structures that support border enforcement between ports of entry are known as tactical infrastructure. This includes fencing and other barriers, roads, and lighting, as well as the electrical and drainage components that serve them. All of these pieces function in support of Border Patrol’s operational needs to execute their mission of establishing a secure border.
The 1,954-mile-long U.S.-Mexico border has some type of barrier along 654 miles, all of which were constructed prior to the Trump administration, and most of which were built following passage of the Secure Fence Act of 2006. To date, all barrier construction during Trump’s presidency has been repairs or replacements to existing structures, although 14 miles of new barrier are slated to begin construction in February 2019, starting in Hidalgo County in southern Texas.
Border barriers can be divided in two categories: pedestrian and vehicle. Pedestrian barriers are those whose primary function is to deter or slow down pedestrians seeking to cross the border. Vehicle barriers are used to deter or prevent the crossing of vehicles but are not functional to hinder individuals on foot. Within these categories, diverse styles are used, some examples of which are shown below. Some sectors of the border have only one type of barrier, while some also have secondary or even tertiary barriers. These extra layers are uncommon but used most extensively in the San Diego, El Paso, and Yuma sectors, which had experienced the largest number of unlawful border crossings during the period of construction in the early 2000s. Most of the primary barriers along the southwest border are pedestrian styles, but the scenario differs across the nine sectors of the U.S.-Mexico border. Among areas with barriers, San Diego and El Centro sectors in California and Yuma sector in Arizona have mostly pedestrian fencing, while Tucson sector in Arizona and El Paso sector (New Mexico and west Texas) have more vehicle fencing. Comparatively, the Big Bend, Del Rio, Laredo, and Rio Grande sectors in Texas have extensive regions without any type of barrier.
Examples of Fencing at the Southwest Border
Double Steel Mesh Style Pedestrian Fence
Source: GAO
Bollard Style Pedestrian Fence
Source: GAO
Expanded Metal Style Pedestrian Fence*
Source: GAO
Landing Mat Style Pedestrian Fence*
Source: GAO
Normandy Style Vehicle Fence
Source: GAO
Bollard Style Vehicle Fencing
Source: GAO
*These designs are considered “legacy” designs by CBP, as opposed to “modern”, and most were constructed prior to new requirements laid out in the Secure Fence Act of 2006.
All weather roads along the border have expanded in recent years, allowing Border Patrol agents to quickly respond detected activity along the border. In Fiscal Year (FY) 2000 these roads covered only 17 miles of the border, and by FY2014 had grown to 145.7 miles. These roads have been leveled and at least partially paved (usually with gravel) to allow for access even during rainy or other severe weather. Approximately 4,904 miles of general patrol roads, that have not been as extensively engineered run along or near the southwest border. President Trump requested $107 million for road maintenance in the FY2019 budget.
All Weather Road at the Southwest Border
Source: GAO
Border lighting is a key part of ensuring the best possible conditions for Border Patrol to execute their duties, according to CBP. Lighting supports the movement of Border Patrol officers as well as the functioning of some surveillance technologies and is believed to deter illegal activities. Limited sections of border barrier are currently lined with stadium lights. Lighting will be part of the 150-foot enforcement zones that will surround planned levees in upcoming construction.
Surveillance Systems
CBP utilizes a diverse and constantly evolving set of surveillance systems on the ground, in the air, and at sea. CBP’s Air and Marine Operations has 240 aircraft and 300 marine vessels currently operating, as well as a staff of about 1,800 federal agents. The office employs 610 pilots, 337 marine interdiction agents, and 256 aviation enforcement agents. Border Surveillance Systems utilized by CBP include ground and maritime radar, ground and aerial video, unattended ground sensors, low-flying aircraft detection, and acoustic sensing devices. Different systems are deployed based on local terrain, types of threats and other factors.
Table 1. Surveillance Assets in All Border Sectors, FY2017 and Prior Years
| Ground-Based | FY2000 | FY2005/2006 | FY2012 | FY2014 | FY2017/2018 |
| Unattended Ground Sensors | 0 | 11,200 | 13,406 | 11,863 | 11,983 |
| Night Vision Goggles | 9255 | 437 | |||
| Thermal Imaging Devices | 600 | ||||
| Remote Video Surveillance Systems (RVSS) | 140 | 269 | 337 | 273 | 200 |
| Border Lighting | 29 miles | 70 miles | |||
| Short and Medium Range Truck-Mounted Mobile Vehicle Surveillance Systems (MVSS) | 0 | 0 | 198 | 178 | 165 |
| Long Range Truck-Mounted Mobile Surveillance Systems | 0 | 0 | 41 | 40 | 90 |
| Hand-Held Portable Medium Range Surveillance Systems | 0 | 0 | 12 | 15 | |
| Integrated Fixed Towers/SBInet | 0 | 0 | 15 | 15 | |
| Aerial and Marine | FY2000 | FY2012 | FY2014 | FY2016 | FY2017 |
| Aircraft | 56 | 249 | 267 | 239 | 240 |
| Flight Hours | 81,045 | 90,740 | 97,088 | 96,760 | |
| Unmanned Aircraft Systems (UAS) | 0 | 10 | 8 | ||
| Flight Hours | 5,735 | 4,611 | 5,540 | ||
| Marine Vehicles | 2 | 293 | 305 | 315 | 300 |
| Underway Hours | 2 | 124,100 | 104,811 | 35,207 | 34,461 |
Source: BPC, CBP (1) (2) (3) (4) (5), DHS, FBO, GAO
Examples of Surveillance Systems at the Southwest Border
Remote Video Surveillance Systems
Source: DHS
Short and Medium Range Truck-Mounted Mobile Vehicle Surveillance Systems
Source: DHS
Long Range Truck-Mounted Mobile Surveillance Systems
Source: DHS
Integrated Fixed Towers
Source: DHS
Examples of CBP’s Aircraft and Marine Vehicles
Super King Air 350R (Multi-Role Enforcement Aircraft)
Source: CBP
MQ-9 Predator B (Unmanned Aircraft System)
Source: CBP
Airbus AS350 A-Star
Source: CBP
38-Foot SAFE Boat
Source: CBP
Tethered Aerostat Radar System
Source: CBP
Funding
Overall funding for border security and enforcement has increased—almost every year and greatly overall—since 2010. President Trump has requested a total budget of $74,438,719 for the Department of Homeland Security in FY2019—an increase of about 4.4 percent over FY2018. Planned investments with the increased funds include new aviation assets, border wall, and surveillance technology like sensors and cameras. Congress provided DHS with $292 million in FY2017 and $1.375B in FY2018 specifically to put toward construction of barriers and other infrastructure, such as border levees.
Figure 2. CBP Budget, FY2010-2019, in Billions of Dollars
Source: White House
Conclusion
Data shows that while there was an increase in apprehensions at the border in FY2018, overall these numbers are significantly lower than peak periods of illegal border crossing and the increase was almost completely from families and children seeking asylum, rather than traditional illegal migration. Some studies have shown that the increase in border security in recent years is at least in part responsible for these declines. However, given the overall low rates of illegal immigration and the shift toward asylum seekers, there is not enough information as to whether additional border resources, infrastructure or otherwise, would have a significant additional impact on reducing illegal migration at the U.S.-Mexico border.
Share
Read Next
Support Research Like This
With your support, BPC can continue to fund important research like this by combining the best ideas from both parties to promote health, security, and opportunity for all Americans.
Give NowRelated Articles
Join Our Mailing List
BPC drives principled and politically viable policy solutions through the power of rigorous analysis, painstaking negotiation, and aggressive advocacy.