What Share of Wages Would Unemployment Insurance Replace? A Look at Several Benefit Levels Under Discussion
Share
Share
Negotiations over the next round of COVID-19 relief have zeroed in on unemployment insurance, and specifically, what to do about the supplemental $600 weekly benefit that expired last week. A closer look at the data reveals that the negotiators on both sides have a leg to stand on. A six-month extension of the weekly supplement at $600 would mean that lower-income workers in nearly every state would continue to collect close to or more than twice as much as their counterparts who remain in the workforce. Lawmakers should instead aim to gradually phase down the supplemental benefit as economic and health conditions improve. On the other hand, renewing the additional benefits at only $200 per week right now would mean a significant overnight income drop for millions of households across the country, even while the pandemic continues to rage.
With more than 30 million displaced workers currently relying on UI and America’s health and economic outlook highly uncertain, the additional federal weekly benefit provides critical support. It has also prevented the bottom from dropping out of the U.S. economy. The Congressional Budget Office, however, estimates that 5 out of 6 unemployed workers would make more on UI than from returning to work if the $600 is extended in its current form.
To make this even more complicated, each state sets its own formula for the standard UI program (excluding the $600 supplement) to determine the portion of wages that are replaced. Wages also vary considerably state by state. The median worker in New Jersey makes $896 a week, compared to $530 in Mississippi, Montana, New Mexico or West Virginia. As a result, the flat $600 federal supplement caused total UI benefit levels to generate very different wage replacement rates across the country.
So, how does the federal government continue to supplement weekly unemployment benefits without disincentivizing work? To help answer this question, BPC used data from the University of Chicago’s Unemployment Insurance Calculator to calculate benefit replacement rates for low-income (25th percentile), median-income (50th percentile), and high-income (75th percentile), UI-eligible unemployed workers in each state under four different federal weekly benefit supplement levels: $0, $200, $400, and $600.1
Share
Read Next
Table 1. Summary of UI Replacement Rates by Federal Supplement and Income Level
| Supplemental Weekly UI Benefit | ||||
|---|---|---|---|---|
| No Federal Supplement ($0) | $200 | $400 | $600 | |
| Low-Income Workers (25th Percentile) | ||||
| Wage Replacement Rate | 52% | 97% | 142% | 187% |
| States With More Than Full Wage Replacement | 0 | 19 | 50 | 50 |
| Median-Income Workers (50th Percentile) | ||||
| Wage Replacement Rate | 50% | 79% | 108% | 138% |
| States With More Than Full Wage Replacement | 0 | 0 | 45 | 50 |
| High-Income Workers (75th Percentile) | ||||
| Wage Replacement Rate | 38% | 54% | 71% | 87% |
| States With More Than Full Wage Replacement | 0 | 0 | 0 | 16 |
As Table 1 shows, allowing the federal supplement to expire has resulted in a dramatic adjustment to weekly benefit levels, with wage replacement rates declining by roughly 90 percentage points for the typical worker. A blanket extension of the $600 weekly supplement, however, would result in the typical unemployed worker continuing to earn substantially more on UI than from their previous job.
Digging deeper, Table 2 contains unemployment benefit replacement rates for the median-income worker in each state, and illustrates considerable differences across the country. Indeed, failing to renew any federal supplement would result in more than a 100 percentage point decline in the wage replacement rate for median-income workers in several states, including Alabama, Iowa, Mississippi, and Oklahoma. Meanwhile, in states like Kentucky, Maine, New Mexico, and North Carolina, keeping the $600 supplement would mean that losing a job continues to result in a pay increase of more than 50% for the typical worker, excluding workplace benefits. For lower-income workers—which comprise an even more outsized share of UI recipients than previously understood, according to a forthcoming update to earlier research from the University of Chicago—those percentages are even higher.2
As we have written, BPC recommends continuing the weekly federal supplement at $400 for the coming months to provide workers with substantial financial assistance across every state, while beginning to rebalance incentives toward work. Pairing this extension with another round of Recovery Rebates (“direct payments”) would ensure that most households on UI do not face any significant change to their financial circumstances and that the economy does not face a large drop in demand at a time of ongoing weakness and uncertainty. Perhaps most importantly, negotiators must urgently prioritize reaching a deal, as the tens of millions of households relying on the program—not to mention the U.S. economy—cannot afford to wait any longer.
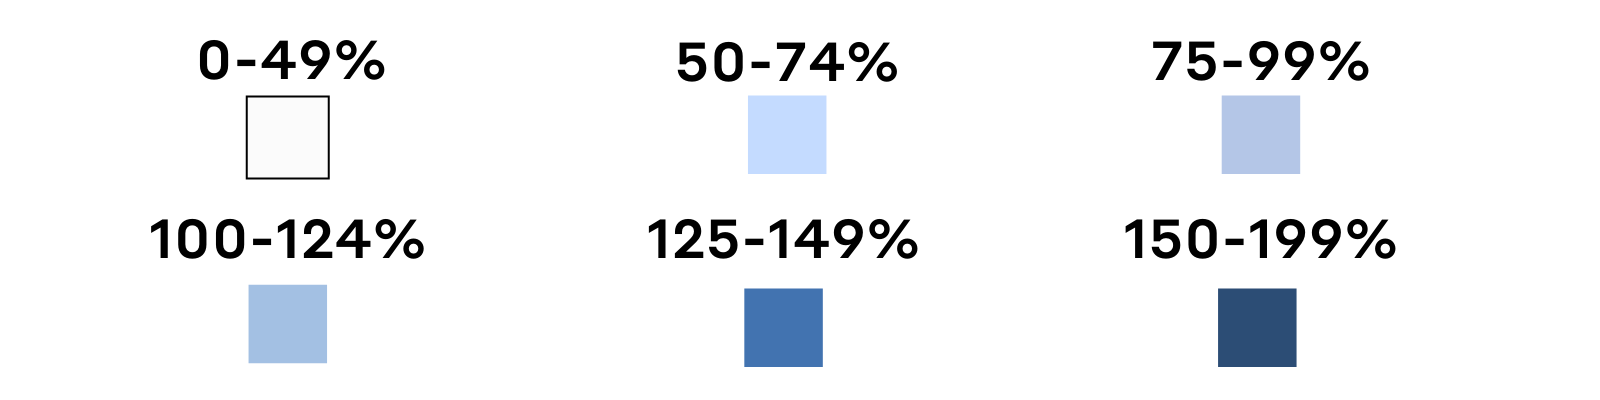
Table 2. State UI Wage Replacement Rates for Median-Income Workers by Federal Supplement Level
Table Key
| State | No Federal Supplement ($0) | $200 | $400 | $600 |
|---|---|---|---|---|
| Nationwide | 50% | 79% | 108% | 138% |
| ALABAMA | 47% | 81% | 115% | 149% |
| ALASKA | 45% | 73% | 100% | 128% |
| ARIZONA | 36% | 66% | 96% | 126% |
| ARKANSAS | 48% | 81% | 114% | 147% |
| CALIFORNIA | 50% | 78% | 105% | 133% |
| COLORADO | 60% | 87% | 114% | 141% |
| CONNECTICUT | 50% | 74% | 99% | 123% |
| DELAWARE | 57% | 88% | 120% | 152% |
| FLORIDA | 44% | 76% | 108% | 140% |
| GEORGIA | 58% | 90% | 122% | 154% |
| HAWAII | 62% | 89% | 117% | 145% |
| IDAHO | 50% | 82% | 114% | 146% |
| ILLINOIS | 47% | 75% | 102% | 130% |
| INDIANA | 45% | 79% | 113% | 147% |
| IOWA | 56% | 90% | 123% | 156% |
| KANSAS | 55% | 86% | 117% | 148% |
| KENTUCKY | 60% | 91% | 123% | 155% |
| LOUISIANA | 38% | 69% | 100% | 131% |
| MAINE | 59% | 93% | 127% | 161% |
| MARYLAND | 49% | 72% | 95% | 118% |
| MASSACHUSETTS | 48% | 73% | 97% | 121% |
| MICHIGAN | 50% | 78% | 105% | 133% |
| MINNESOTA | 50% | 78% | 105% | 133% |
| MISSISSIPPI | 44% | 82% | 120% | 158% |
| MISSOURI | 51% | 83% | 115% | 147% |
| MONTANA | 50% | 88% | 125% | 163% |
| NEBRASKA | 48% | 80% | 112% | 144% |
| NEVADA | 52% | 83% | 114% | 145% |
| NEW HAMPSHIRE | 50% | 78% | 105% | 133% |
| NEW JERSEY | 58% | 80% | 102% | 125% |
| NEW MEXICO | 54% | 91% | 129% | 167% |
| NEW YORK | 52% | 77% | 102% | 127% |
| NORTH CAROLINA | 50% | 85% | 120% | 155% |
| NORTH DAKOTA | 50% | 82% | 113% | 145% |
| OHIO | 48% | 77% | 107% | 136% |
| OKLAHOMA | 56% | 92% | 127% | 162% |
| OREGON | 63% | 92% | 121% | 150% |
| PENNSYLVANIA | 51% | 80% | 109% | 137% |
| RHODE ISLAND | 50% | 78% | 105% | 133% |
| SOUTH CAROLINA | 50% | 82% | 114% | 146% |
| SOUTH DAKOTA | 50% | 82% | 114% | 146% |
| TENNESSEE | 44% | 76% | 108% | 140% |
| TEXAS | 52% | 83% | 115% | 146% |
| UTAH | 49% | 81% | 113% | 145% |
| VERMONT | 58% | 86% | 115% | 143% |
| VIRGINIA | 52% | 80% | 107% | 135% |
| WASHINGTON | 50% | 73% | 97% | 120% |
| WEST VIRGINIA | 53% | 91% | 128% | 166% |
| WISCONSIN | 52% | 84% | 116% | 148% |
| WYOMING | 52% | 81% | 111% | 140% |
Appendix:
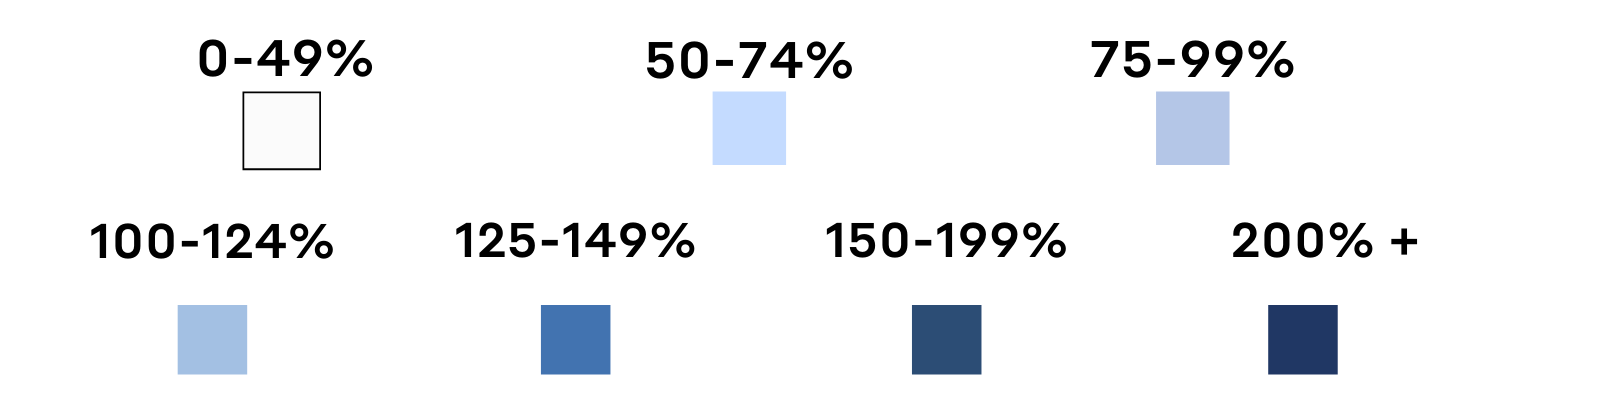
Table A1. State UI Wage Replacement Rates for Low-Income (25th Percentile) Workers by Federal Supplement Level
Table Key
| State | No Federal Supplement ($0) | $200 | $400 | $600 |
|---|---|---|---|---|
| Nationwide | 52% | 97% | 142% | 187% |
| ALABAMA | 54% | 104% | 154% | 204% |
| ALASKA | 58% | 100% | 142% | 184% |
| ARIZONA | 52% | 98% | 143% | 189% |
| ARKANSAS | 48% | 101% | 153% | 206% |
| CALIFORNIA | 50% | 96% | 141% | 187% |
| COLORADO | 60% | 102% | 144% | 186% |
| CONNECTICUT | 50% | 93% | 137% | 180% |
| DELAWARE | 57% | 107% | 157% | 207% |
| FLORIDA | 50% | 98% | 146% | 193% |
| GEORGIA | 62% | 110% | 158% | 207% |
| HAWAII | 62% | 105% | 148% | 192% |
| IDAHO | 50% | 102% | 155% | 207% |
| ILLINOIS | 47% | 93% | 138% | 184% |
| INDIANA | 45% | 91% | 137% | 182% |
| IOWA | 57% | 102% | 148% | 194% |
| KANSAS | 55% | 101% | 147% | 192% |
| KENTUCKY | 59% | 111% | 163% | 215% |
| LOUISIANA | 60% | 110% | 160% | 210% |
| MAINE | 59% | 109% | 159% | 209% |
| MARYLAND | 49% | 92% | 130% | 168% |
| MASSACHUSETTS | 48% | 85% | 123% | 160% |
| MICHIGAN | 53% | 95% | 137% | 179% |
| MINNESOTA | 50% | 93% | 136% | 179% |
| MISSISSIPPI | 50% | 105% | 160% | 216% |
| MISSOURI | 52% | 98% | 143% | 189% |
| MONTANA | 50% | 102% | 154% | 207% |
| NEBRASKA | 48% | 94% | 139% | 185% |
| NEVADA | 52% | 98% | 143% | 189% |
| NEW HAMPSHIRE | 50% | 92% | 134% | 176% |
| NEW JERSEY | 58% | 95% | 132% | 170% |
| NEW MEXICO | 54% | 112% | 170% | 229% |
| NEW YORK | 52% | 93% | 134% | 174% |
| NORTH CAROLINA | 50% | 100% | 150% | 200% |
| NORTH DAKOTA | 50% | 96% | 141% | 187% |
| OHIO | 48% | 91% | 134% | 177% |
| OKLAHOMA | 57% | 107% | 157% | 207% |
| OREGON | 63% | 108% | 154% | 200% |
| PENNSYLVANIA | 51% | 97% | 143% | 188% |
| RHODE ISLAND | 50% | 91% | 132% | 173% |
| SOUTH CAROLINA | 50% | 96% | 141% | 187% |
| SOUTH DAKOTA | 50% | 98% | 146% | 193% |
| TENNESSEE | 50% | 96% | 141% | 187% |
| TEXAS | 52% | 98% | 143% | 189% |
| UTAH | 49% | 95% | 140% | 186% |
| VERMONT | 58% | 102% | 146% | 189% |
| VIRGINIA | 52% | 98% | 143% | 189% |
| WASHINGTON | 50% | 87% | 125% | 162% |
| WEST VIRGINIA | 53% | 110% | 166% | 223% |
| WISCONSIN | 52% | 100% | 148% | 196% |
| WYOMING | 52% | 98% | 143% | 189% |
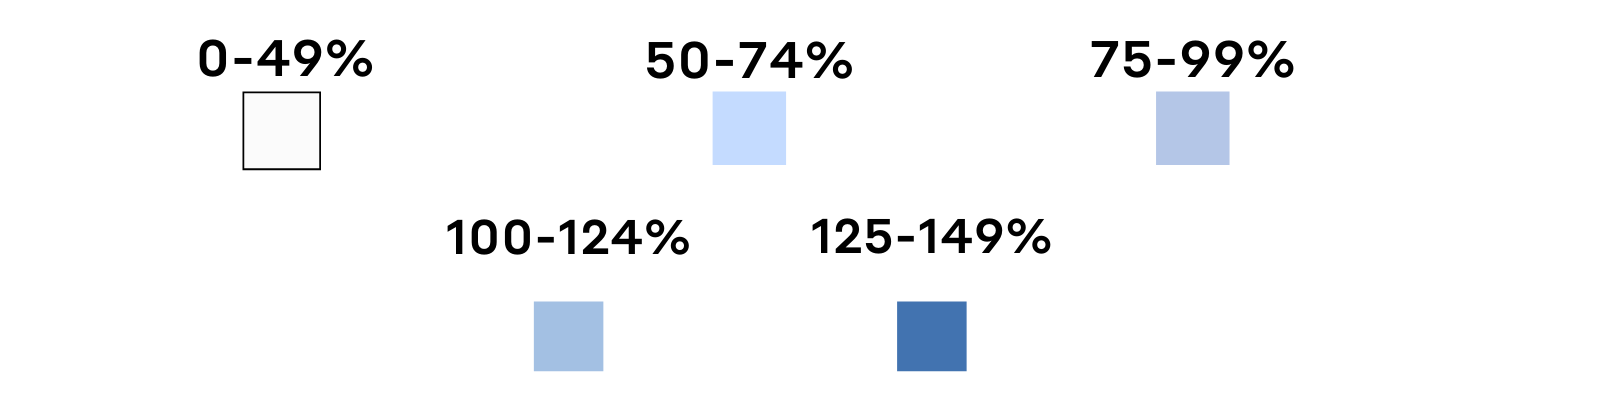
Table A2. State UI Wage Replacement Rates for High-Income (75th Percentile) Workers by Federal Supplement Level
Table Key
| State | No Federal Supplement ($0) | $200 | $400 | $600 |
|---|---|---|---|---|
| Nationwide | 38% | 54% | 71% | 87% |
| ALABAMA | 28% | 48% | 68% | 88% |
| ALASKA | 29% | 44% | 60% | 75% |
| ARIZONA | 20% | 37% | 54% | 71% |
| ARKANSAS | 48% | 69% | 91% | 112% |
| CALIFORNIA | 34% | 50% | 65% | 80% |
| COLORADO | 45% | 60% | 75% | 89% |
| CONNECTICUT | 47% | 61% | 76% | 90% |
| DELAWARE | 37% | 55% | 73% | 91% |
| FLORIDA | 25% | 43% | 62% | 80% |
| GEORGIA | 32% | 50% | 68% | 85% |
| HAWAII | 53% | 70% | 86% | 102% |
| IDAHO | 43% | 62% | 82% | 101% |
| ILLINOIS | 38% | 53% | 69% | 84% |
| INDIANA | 39% | 59% | 79% | 99% |
| IOWA | 48% | 68% | 88% | 108% |
| KANSAS | 45% | 63% | 81% | 99% |
| KENTUCKY | 48% | 66% | 84% | 103% |
| LOUISIANA | 23% | 41% | 59% | 77% |
| MAINE | 45% | 66% | 86% | 107% |
| MARYLAND | 29% | 43% | 56% | 70% |
| MASSACHUSETTS | 48% | 62% | 75% | 88% |
| MICHIGAN | 30% | 47% | 64% | 81% |
| MINNESOTA | 48% | 64% | 79% | 95% |
| MISSISSIPPI | 26% | 48% | 70% | 93% |
| MISSOURI | 29% | 48% | 66% | 84% |
| MONTANA | 50% | 71% | 93% | 114% |
| NEBRASKA | 38% | 56% | 73% | 91% |
| NEVADA | 39% | 56% | 73% | 90% |
| NEW HAMPSHIRE | 34% | 50% | 66% | 82% |
| NEW JERSEY | 45% | 58% | 71% | 83% |
| NEW MEXICO | 51% | 73% | 95% | 118% |
| NEW YORK | 34% | 48% | 61% | 75% |
| NORTH CAROLINA | 35% | 54% | 74% | 94% |
| NORTH DAKOTA | 50% | 70% | 89% | 109% |
| OHIO | 44% | 62% | 80% | 99% |
| OKLAHOMA | 54% | 74% | 94% | 114% |
| OREGON | 54% | 71% | 88% | 105% |
| PENNSYLVANIA | 47% | 64% | 80% | 97% |
| RHODE ISLAND | 46% | 61% | 77% | 92% |
| SOUTH CAROLINA | 33% | 53% | 73% | 93% |
| SOUTH DAKOTA | 41% | 62% | 82% | 102% |
| TENNESSEE | 28% | 48% | 68% | 88% |
| TEXAS | 46% | 64% | 81% | 99% |
| UTAH | 50% | 68% | 86% | 104% |
| VERMONT | 48% | 66% | 85% | 104% |
| VIRGINIA | 26% | 39% | 53% | 66% |
| WASHINGTON | 50% | 64% | 79% | 93% |
| WEST VIRGINIA | 47% | 69% | 91% | 114% |
| WISCONSIN | 37% | 57% | 77% | 97% |
| WYOMING | 48% | 67% | 86% | 105% |
End Notes:
1 For each state, the University of Chicago’s calculator provides the income as well as the pre-crisis weekly unemployment benefit levels (i.e., excluding the $600 federal supplement) associated with low-income (25th percentile), median-income (50th percentile), and high-income (75th percentile) unemployed workers who are eligible for benefits. Using these data, BPC calculated benefit wage replacement rates for low-, median, and high-income workers in each state under each scenario by adding the hypothetical weekly federal supplement level to the reported pre-crisis benefit level and dividing the total weekly benefit by median weekly earnings.
2 See the appendix for resulting benefit wage replacement rates for low- and high-income workers by state.
Support Research Like This
With your support, BPC can continue to fund important research like this by combining the best ideas from both parties to promote health, security, and opportunity for all Americans.
Give NowRelated Articles
Join Our Mailing List
BPC drives principled and politically viable policy solutions through the power of rigorous analysis, painstaking negotiation, and aggressive advocacy.