Ten Charts that Explain BPC’s Updated Baseline
Share
Share
Samantha Greene contributed to this post.
The Congressional Budget Office (CBO) released its latest Budget and Economic Outlook earlier this week. There has been much discussion of appendices B and C of that report, which addressed the impact of the Affordable Care Act on jobs and health insurance coverage. We have no new insight to add to those discussions, and instead have focused on using CBO’s newest projections to update the BPC baseline, which incorporates the new projections and extends their implications through 2053.
These projections, like all others, are subject to error. In particular, we would like to point out that budget estimates are highly influenced by economic projections. In light of recent disappointing employment and the fact that most economic projections over the last five years have been overly optimistic, future deficits could be larger than we report here if the economy grows more slowly than anticipated. With those caveats in mind, however, we found a number of interesting stories within the updated numbers that we present in chart form below:
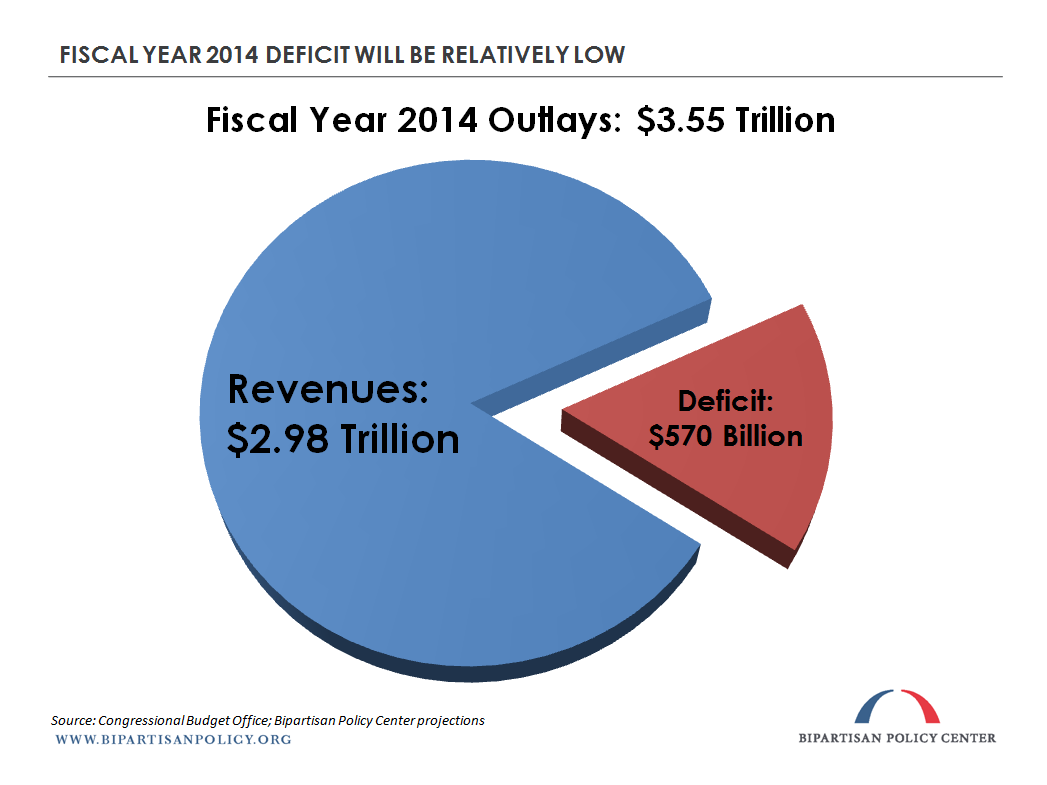
1. The deficit this year is relatively small. Only about 16 percent of federal spending will have to be funded by net borrowing in Fiscal Year 2014. But this situation won’t last long. By the end of the ten-year window in 2024, approximately 19 percent of federal spending will not be covered by revenues and BPC projects that percentage will rise relentlessly ? to 43 percent in 2053.
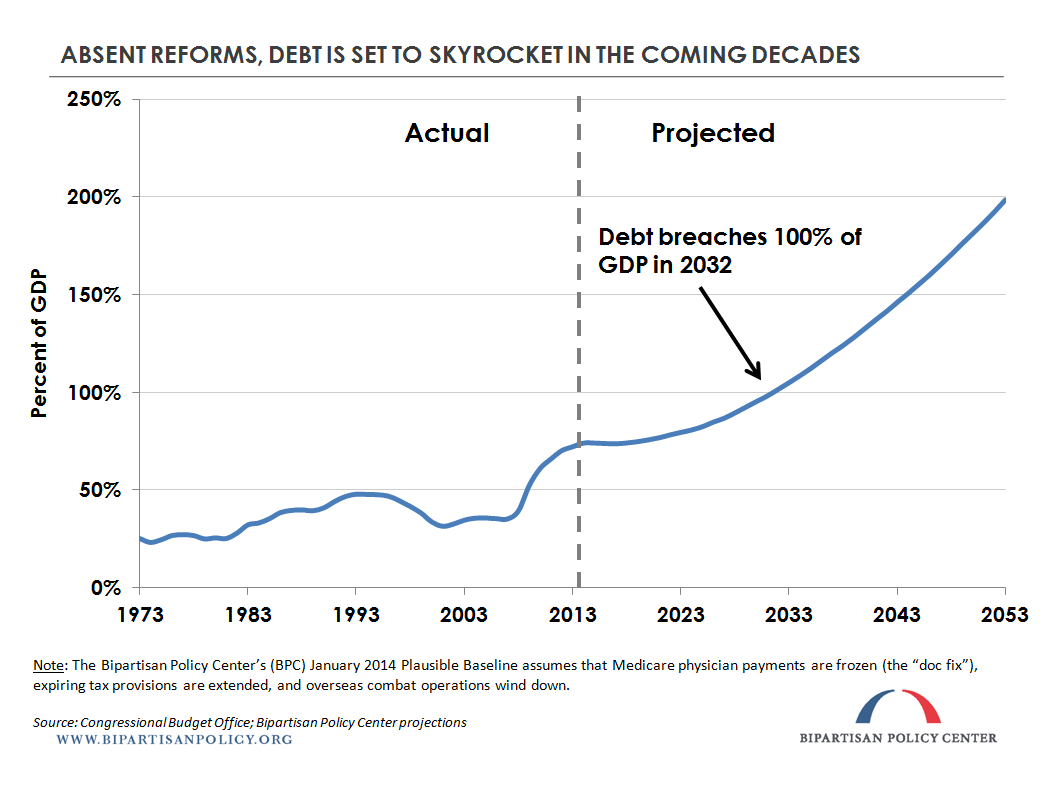
2. As those deficits accumulate year after year, debt held by the public will rise quickly. Its growth as a percentage of the economy (gross domestic product (GDP)) will stay relatively moderate through the end of the ten-year window, but debt will rise steeply thereafter. BPC projects that federal debt held by the public will reach 100 percent of GDP in 2032.
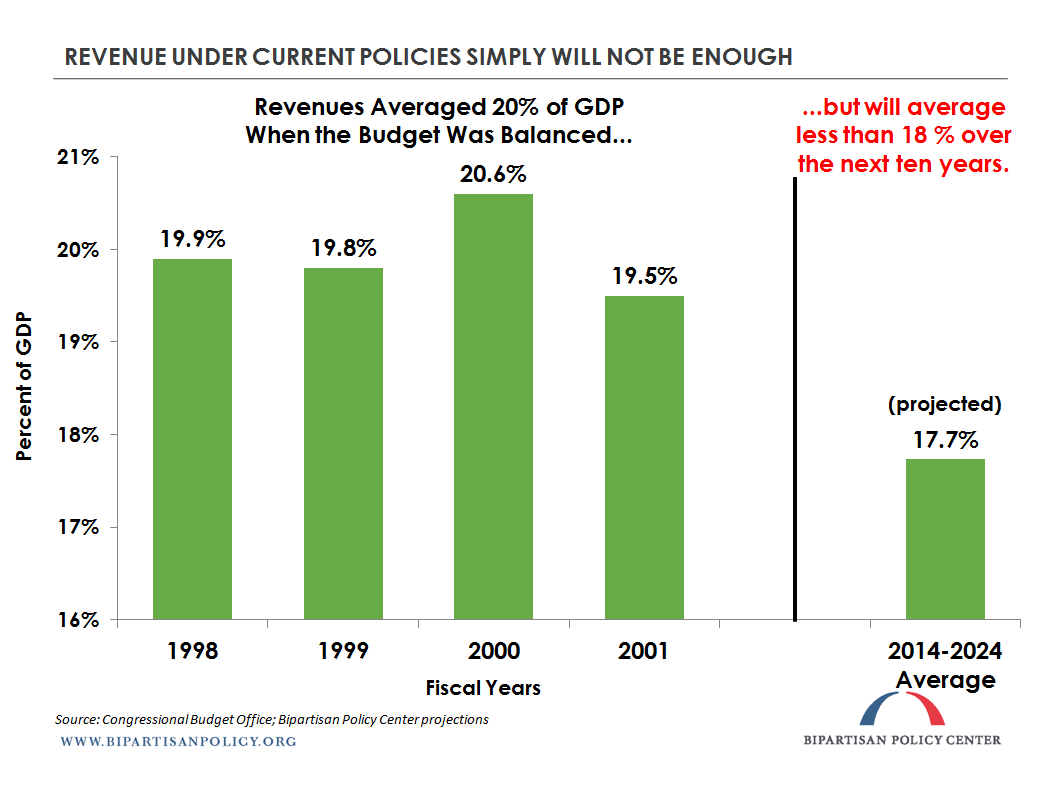
3. Part of the problem is that revenues from our inefficient, unreformed tax code remain too low. Even if, according to forecasts, the economy gets back on track in the coming years, revenues will be a much smaller share of GDP than they were when we managed to balance the budget.
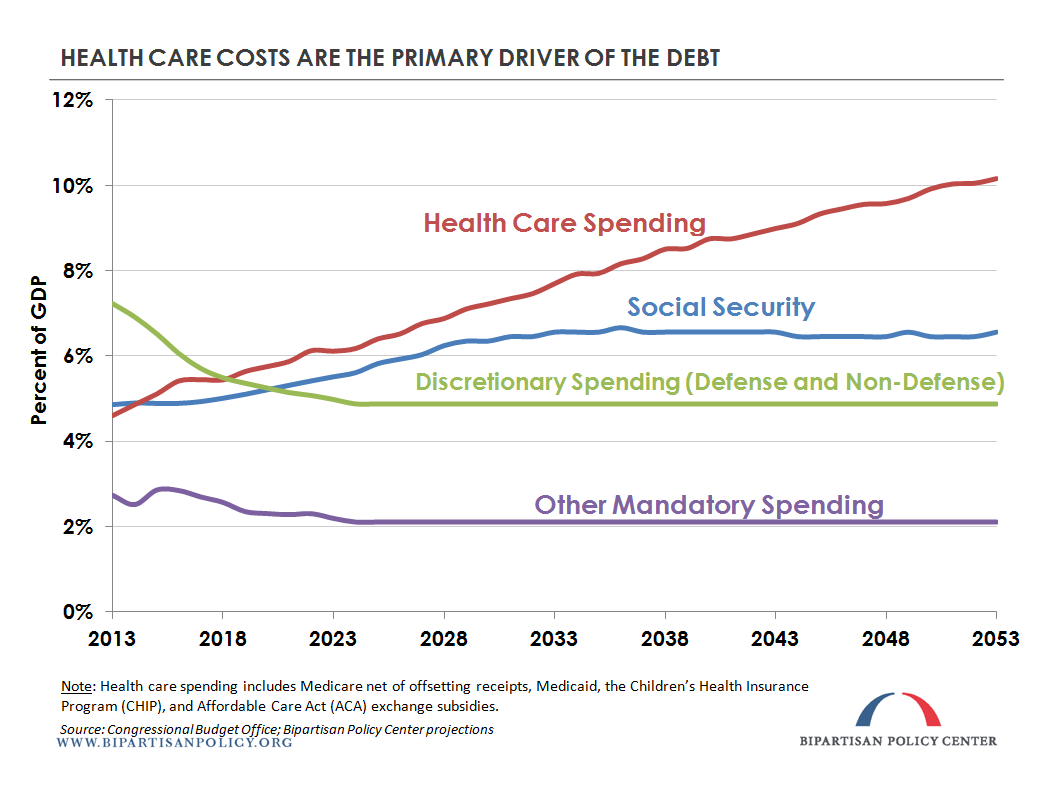
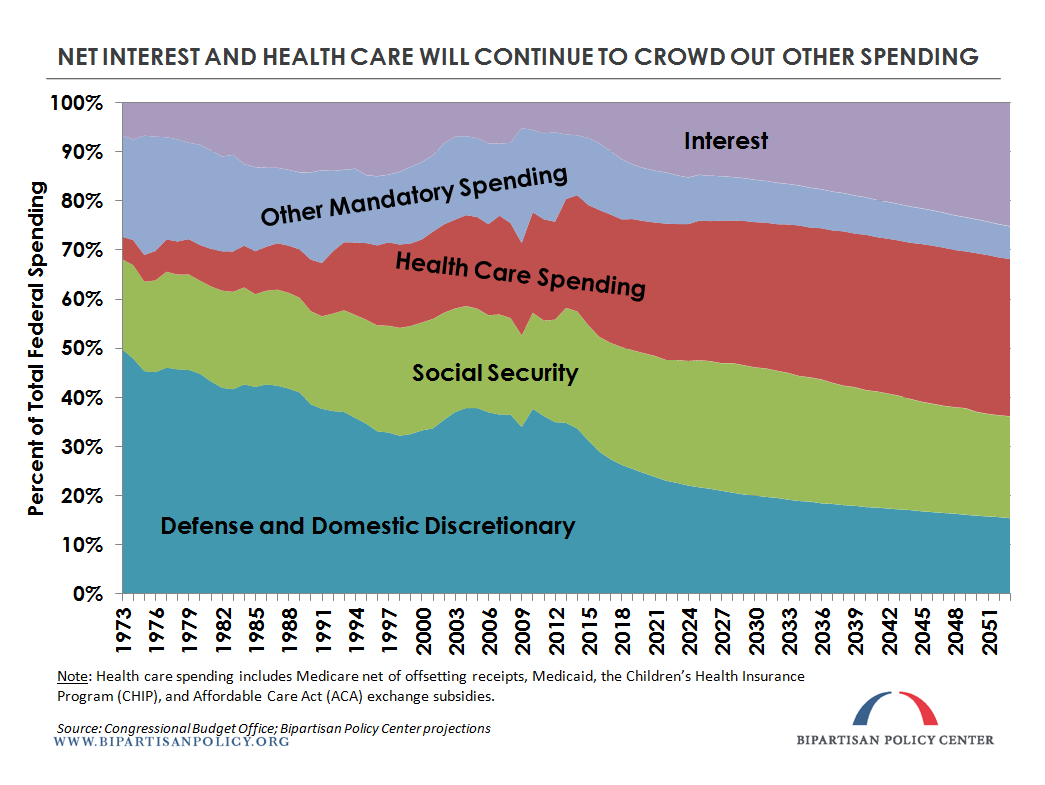
4. The other major part of the problem is the runaway costs of health care spending. In the last several years, Social security and total health care spending on major programs (Medicare, Medicaid, Children’s Health Insurance Program , and Affordable Care Act exchange subsidies) traded places as the largest item in the budget several times. Although health care growth has been slow for the last few years, total spending on major health care programs is projected to overtake Social Security this year and remain larger through the end of the ten-year window.
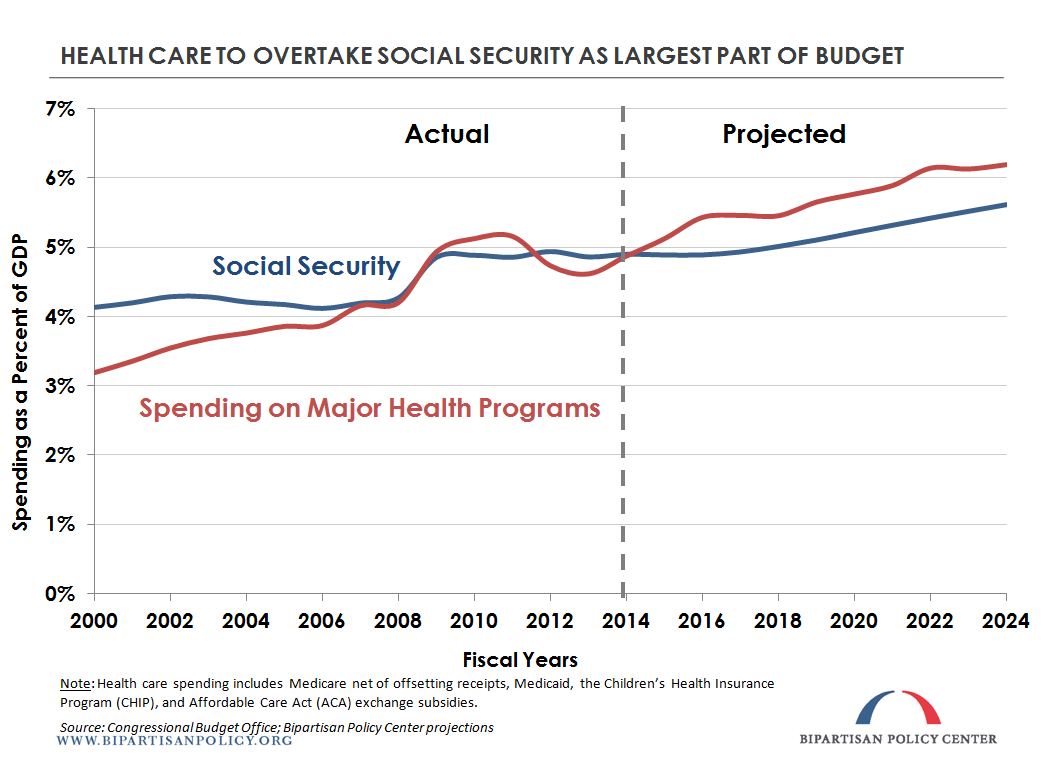
5. In fact, while all of the other major categories of spending are projected to decrease or level off at some point in the next few decades, health care spending is projected to increase as a share of the economy for the indefinite future. Clearly, this trend cannot go on forever, but bending that curve will require cost-effective reforms to the system, such as those proposed by BPC’s Health Care Cost Containment Initiative last year.
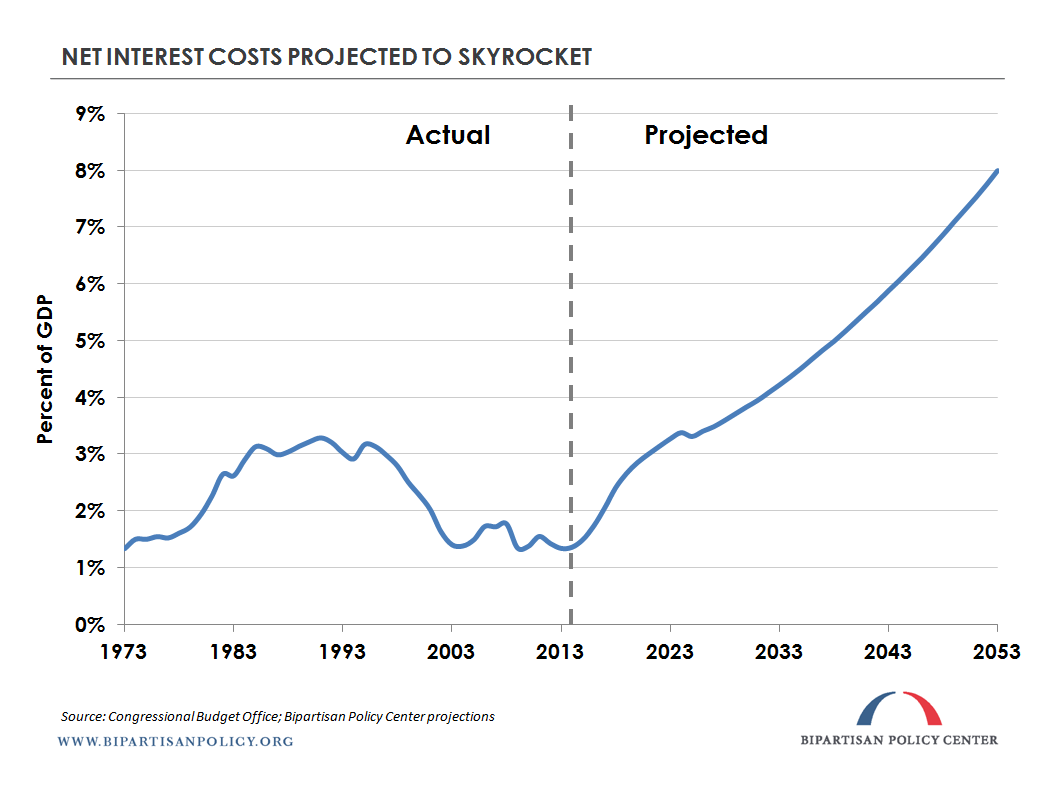
6. Net interest costs are at unusually low levels right now. If CBO’s projections materialize and interest rates return to more normal levels over the next few years, interest payments will rise sharply in the next ten years and continue on an upward trajectory through the end of 2053.
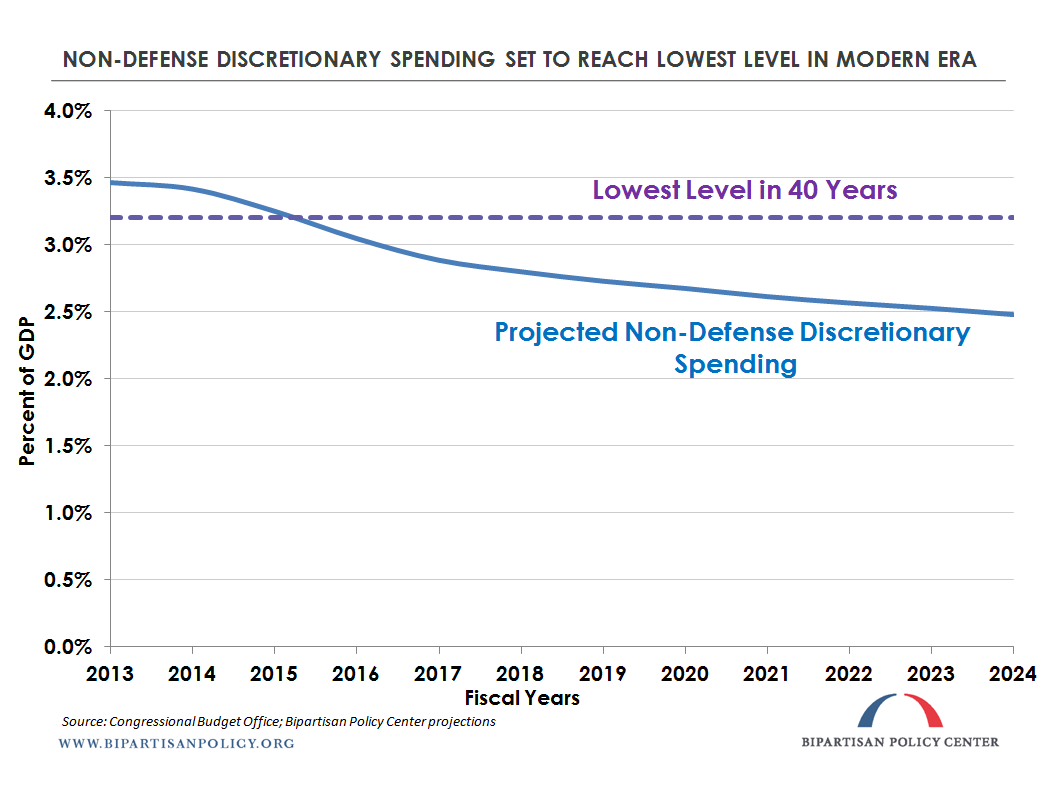
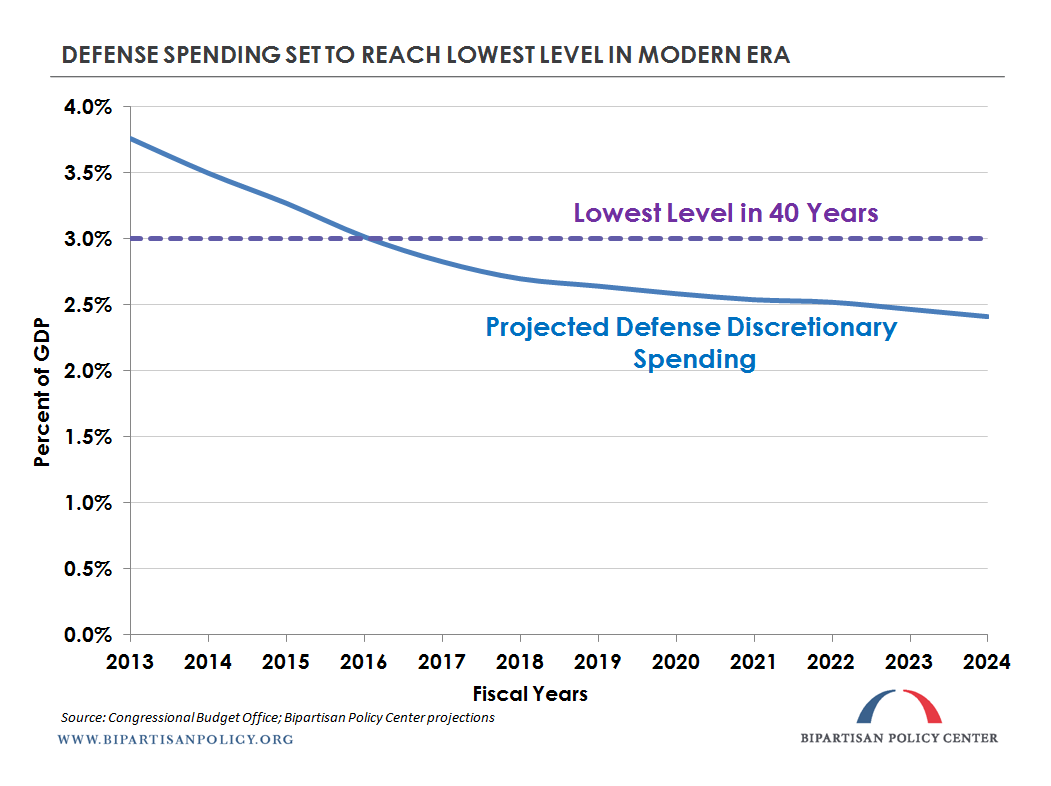
7. As interest payments and healthcare costs inexorably rise, discretionary spending ? encompassing defense and nondefense spending ? is soon projected to reach all-time lows as a share of GDP since 1973.1
8. Zooming out and looking at the long-run picture, interest payments and health spending are set to grow quickly as portions of the federal budget, crowding out priorities in other areas.
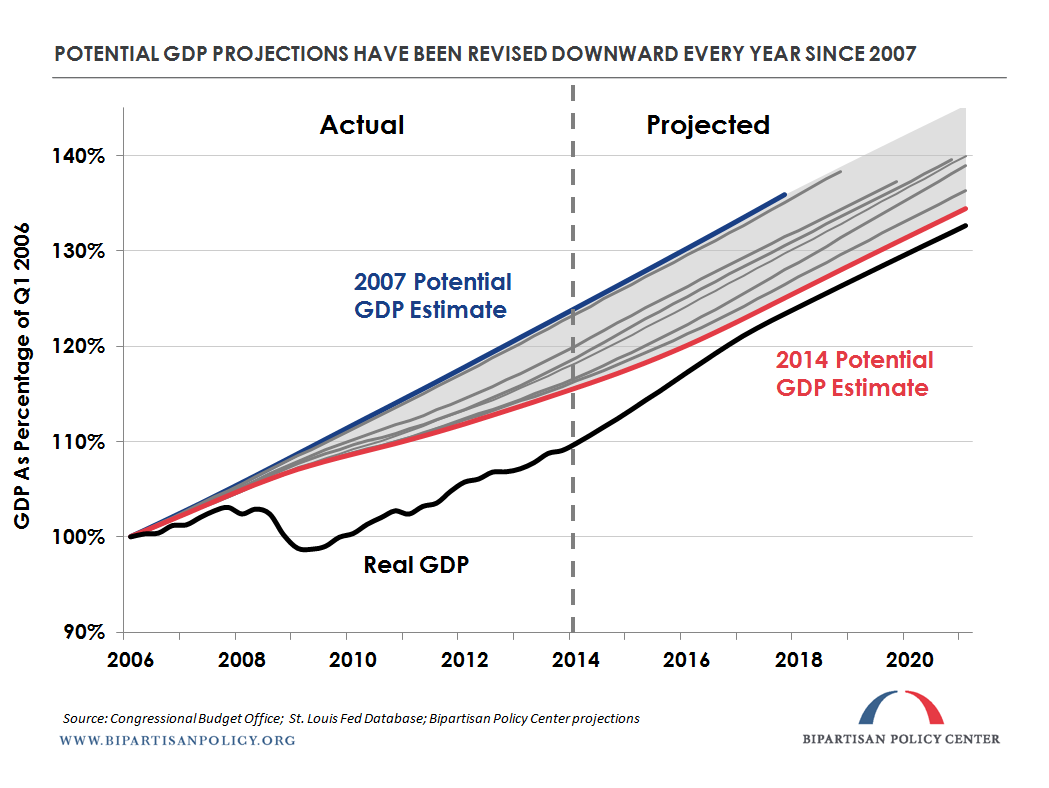
9. Finally and depressingly, economic growth is not projected to pick up the slack. Every annual projection since 2007 has seen CBO lower their expectation of the long term trend of economic growth (after adjusting for inflation).2 CBO’s estimate of potential inflation-adjusted growth in the economy averages only 2.2 percent over the next ten years.
Alex Gold contributed to this post.
1
“Discretionary spending” is the portion of government spending that Congress must approve (appropriate) each year. It makes up about one-third of the federal budget. Discretionary spending funds many programs, including almost the entire defense budget, scientific research, head start, the FBI, and much more.
Other programs, so-called “mandatory spending,” are automatically funded every year without congressional action. Mandatory spending currently makes up about 60 percent of the federal budget and funds Medicare, Medicaid, and Social Security, among other programs.
The final portion of the federal budget?around 6 percent?is interest paid on public debt.
2
Hat tip to Jared Bernstein for pointing out this important part of the CBO projections on the New York Times Economix blog.
Share
Read Next
Support Research Like This
With your support, BPC can continue to fund important research like this by combining the best ideas from both parties to promote health, security, and opportunity for all Americans.
Give NowRelated Articles
Join Our Mailing List
BPC drives principled and politically viable policy solutions through the power of rigorous analysis, painstaking negotiation, and aggressive advocacy.