Projected Impact of Changing Conditions on Electricity Generation
Share
Share
The electric power sector in the United States is facing a changing market and regulatory environment that continues to influence the relative competitive positions of various forms of electricity generation. The new BPC staff report, Projected Impact of Changing Conditions on the Power Sector, sheds light on these changes and updates analysis presented in the June 2011 BPC staff paper, Environmental Regulation and Electric System Reliability.
To help understand these dynamics, we continue to analyze the power sector with ICF International’s Integrated Planning Model (IPM),* which simulates economic decisions by electricity generators based on the assumed market and policy conditions. BPC defined two scenarios?a Base Case and a Policy Case?to specifically examine the impacts of the Environmental Protection Agency’s (EPA) recent air regulations for the U.S. power sector, namely the Mercury and Air Toxics Standards (MATS) for power plants and the Cross-State Air Pollution Rule (CSAPR).
Findings on Coal Plant Retirements
According to this analysis, a total of 56 gigawatts (GW) of coal-fired generating capacity is expected to retire by 2016, with 40 GW retiring under market conditions and an additional 16 GW retiring as a result of MATS and CSAPR compliance requirements. These retirements would amount to 5 percent of the total 2012 fleet and nearly 18 percent of 2012 coal capacity.
Figure 1: Projected Fate of Current Fleet by 2016**
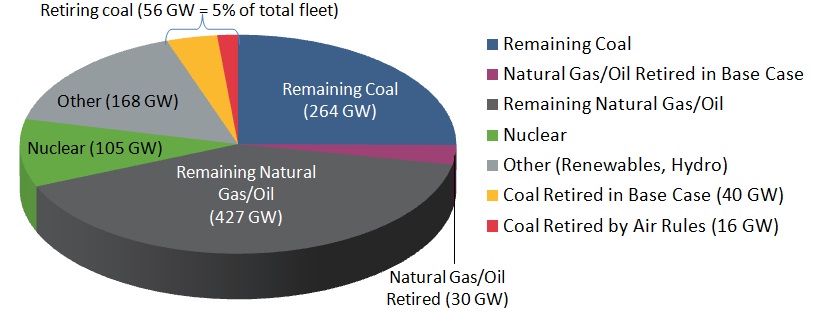
For the yellow slice of retirements in Figure 1, the key retirement drivers are projected low and stable natural gas prices, higher coal prices, and limited growth in the demand for electricity. These variables have experienced significant changes in recent years. This updated BPC analysis is largely based on the Early Release of the 2012 Energy Information Administration’s Annual Energy Outlook (EIA AEO 2012). The units projected to retire tend to be older, smaller, and less efficient on average than the rest of the fleet and tend to operate much less frequently than baseload coal capacity: 74 percent of the projected retiring coal is at least 40 years old, 50 percent are 200-megawatt capacity or less, and 55 percent have heat rates of at least 11,000 mmBtu. (Higher heat rates indicate lower efficiency.)
Generation Changes Don’t Equate with Capacity Changes
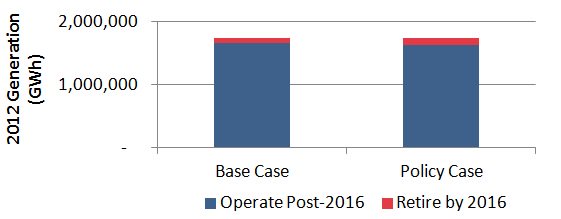
Because of their infrequent use, the coal plants that are retiring contribute only a small percentage (see the red portion in Figure 2) to the total amount of electricity projected from coal-fired generators in 2012. Even though nearly 18 percent of 2012 coal capacity is projected to retire, the retiring units account for only 6 percent of the projected coal generation in 2012 (in the Policy Case).
Figure 2: 2012 Generation from Retiring and Non-Retiring Coal-fired Units
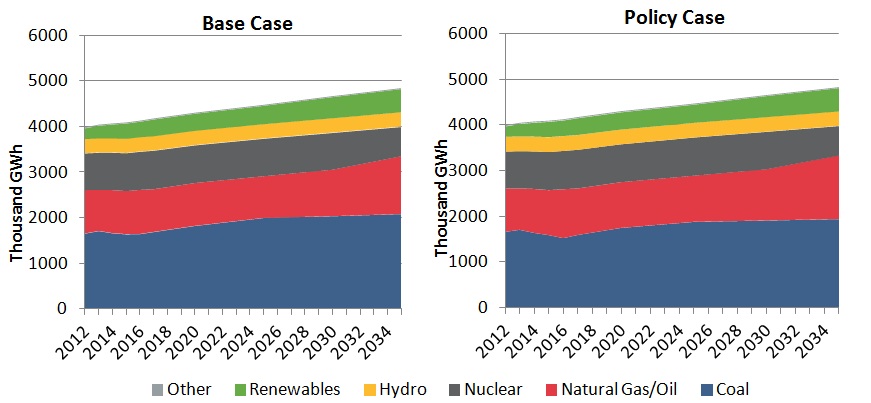
Furthermore, by 2020, with adjusting fuel prices and electricity demand growth, the amount of electricity generated from coal-fired facilities is projected to increase above current levels and continue to grow well beyond today’s historically low level to reach 2007 ? 2008 levels around 2025. Thus, even with the economics recently favoring natural gas generation, coal is projected to remain the largest generation source in both the Base and Policy Cases of this analysis (Figure 3). Notwithstanding, it is possible that future environmental requirements that have yet to be promulgated and are not included in this analysis?such as stricter NOX and/or particulate limits, greenhouse gas limits for existing sources, coal ash handling, and cooling water requirements?could influence the future generation mix, particularly in the coming decades.
Figure 3: Generation Mix for the Base and Policy Cases 2012 ? 2035
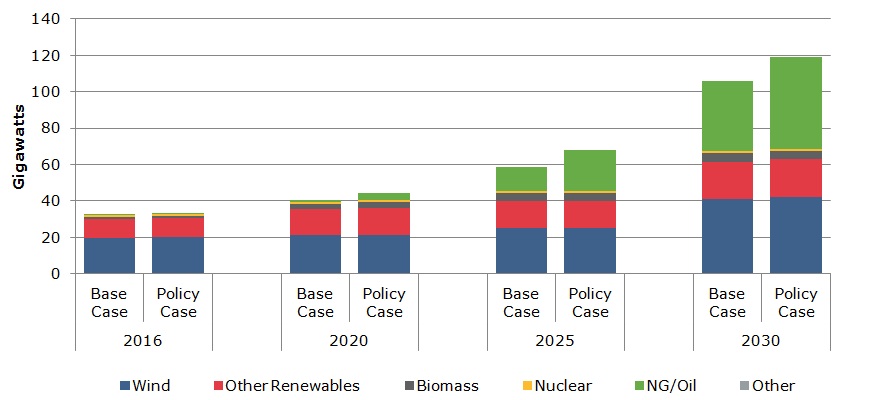
Because existing coal and natural gas units are able to pick up the slack from retirements and electricity demand growth is slow, new capacity is not immediately needed to replace retirements on a one-to-one basis. In the short term, the projected build mix is dominated by renewable capacity as states work to meet Renewable Portfolio Standards. New natural gas turbines increasingly supplement capacity in the next decade (Figure 4). Although this analysis does not include the EPA’s proposed New Source Performance Standard for greenhouse gases?which would essentially require any new coal units to include carbon capture and sequestration?these results would not be impacted by such a requirement, because of the lack of projected new coal builds.
Figure 4: Cumulative Projected Capacity Additions***
Available Compliance Options Impact Costs and Retirements
Of the pollution controls expected for compliance with the various limits in CSAPR and MATS, a wet scrubber is the most expensive technology. Some previous analyses assumed that all plants would require wet scrubbers for compliance, which increased projected costs and resulting coal plant retirements. Instead, BPC analysis allows the model to choose the most economic compliance strategy from the cost and performance data specified in the final rulemakings, which include additional lower-cost technologies and fuel-switching options.
Figure 5: Compliance with SO2 and HCl Requirements (CSAPR and MATS)**** for Non-Retiring Units

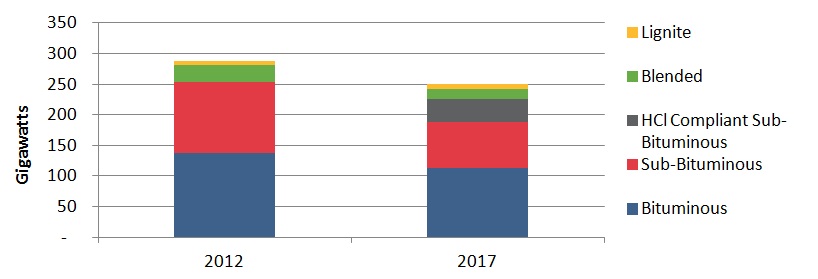
Figure 5 shows that almost 70 percent of the coal capacity projected to remain in operation through 2016 already has scrubbers in place, although some require upgrades. To comply with the SO2 requirements of CSAPR and HCl limit in MATS, 13 percent of the coal capacity forecasted to remain in operation is projected to add control technology, including wet and dry scrubbers and dry sorbent injection (DSI). In addition, almost 20 percent (49 GW) of the remaining coal-fired fleet is projected to comply by burning compliant coal*****?primarily western coal with low enough sulfur and chlorine content to avoid add-on pollution controls for SO2/acid gases. The units projected to burn such compliant coal have previously burned western coal either in total or as part of a blend (see Figure 6). Because these units are not expected to install a scrubber or operate dry sorbent injection (DSI), their compliance costs could be significantly less than most analyses assume and they are projected to avoid retirement and remain competitive.
Figure 6: Impact of Policy on Coal Switching: Coal Consumption by GW of Capacity
* IPM is a multi-region model that endogenously determines capacity- and transmission-expansion plans; unit dispatch and compliance decisions; and power, coal, and allowance price forecasts?all based on power-market fundamentals. To use the model, it is necessary to make a number of assumptions concerning key market parameters, including electricity demand growth, fuel prices, cost and performance of new generating capacity, and cost and performance of pollution controls and other options for complying with environmental regulations. With complex and differing financial, regulatory, and local considerations influencing the investment decisions for specific generators, IPM is not intended to accurately predict each unit level decision, but rather is designed to reflect national trends and to incorporate the key drivers of investment and dispatch decisions.
** New additions not included.
*** Does not include firm builds, which are units under construction or sufficiently far along in the permitting / financing process.
**** Analysis based on BPC Spring 2012 Policy Case; Additional controls, such as particulate control upgrades/retrofits and Activated Carbon Injection (ACI), may also be required to comply with the regulations.
***** The compliant coal is primarily Powder River Basin/western sub-bituminous coal with low enough chlorine and sulfur contents to meet the HCl and SO2 emission requirements without add-on controls. This is projected to result in a premium for such compliant coal.
Share
Read Next
Support Research Like This
With your support, BPC can continue to fund important research like this by combining the best ideas from both parties to promote health, security, and opportunity for all Americans.
Give Now