Orszag: Residential Segregation, Not Redistricting, to Blame for Polarization
Share
Share
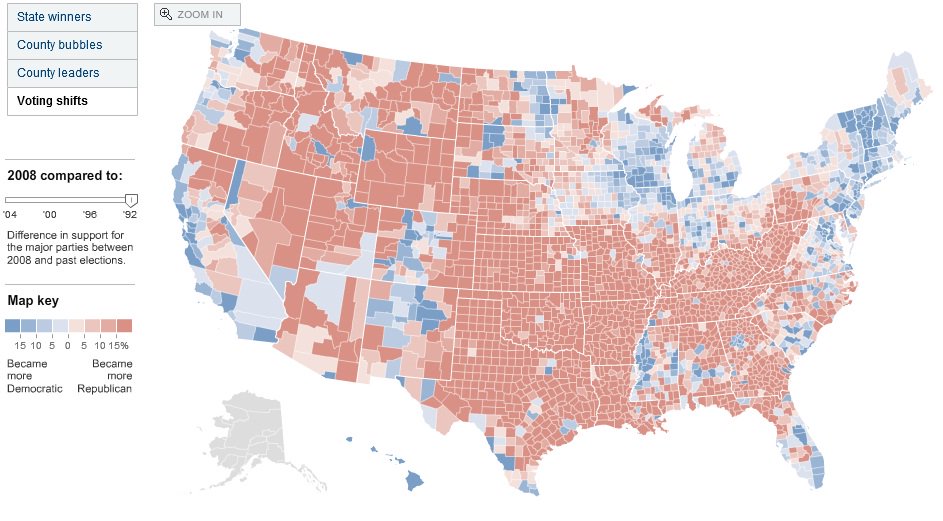
Map #1: Changes from the 1992 election to the 2008 election. Red denotes a trend toward the Republican Party. Blue denotes a trend toward the Democratic Party. Courtesy of The New York Times.
Bloomberg columnist Peter Orszag, former director of the Office of Management and Budget, is out with a piece today highlighting political polarization. Orszag notes that many people blame partisan redistricting practices for increasing polarization over the last three decades. If that assumption were true, he posits, altering redistricting rules would solve the problem:
“A closer look at Congress…shows that redistricting isn’t a major cause of our polarization at all. Compare, for example, historical trends in the House and the Senate. Senate districts are states, so they aren’t continually redrawn as congressional districts are. And yet the polarization patterns in the House and Senate have broadly tracked each other. Polarization between the two parties was relatively high in both houses for the first three decades of the 20th century. It dipped in the House and Senate alike from the mid- 1930s until the late 1970s, and then began climbing to record highs today.”
Orszag’s main argument relates to a concept he terms “residential segregation.” More and more, Americans are congregating with like-minded neighbors, deepening a culture of political entrenchment. On a macro level, the 2008 presidential election was a decisive victory for President Obama. He won 53 percent of the popular vote, something that had not been done since George H.W. Bush’s 1988 victory. Look closer at the 2008 map, though, and you see that the traditionally Democratic states took on a deeper blue shade at the same time the reliably Republican strongholds became crimson red. The trend continued in the 2010 midterm elections.
Visualizing Presidential Voting Shifts
Map #2 and #3: Changes from the 1976 election (#2) to the 2008 election (#3). White counties are listed as competitive. Gray counties are listed as Republican landslides. Black counties are listed as Democratic landslides. Notice the dramatic drop in the number of competitive counties and the corresponding rise in landslide counties.
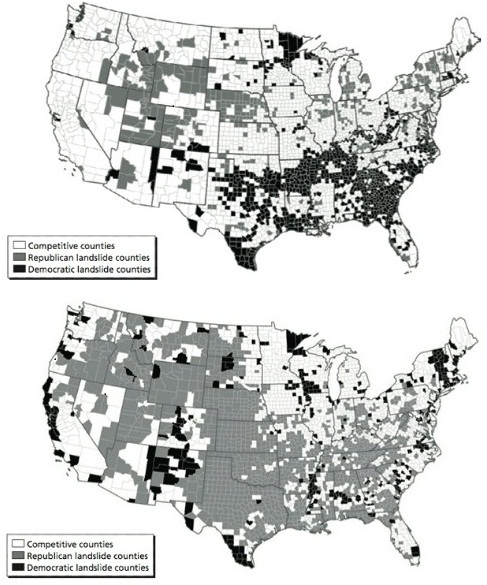
Courtesy of Bloomberg News
Consequences
Orszag concludes:
“The consequences are far-reaching. The social psychology literature clearly shows that when like-minded people are put together, they move to extremes — both because they rarely hear opposing viewpoints and because each person is at least somewhat inclined to prove he is the true believer in the group… We should try to create a new set of rules and institutions that can use legislative inertia to our benefit — just as a growing body of tools in the private sector, such as automatic- enrollment 401(k) plans, are using inertia there to produce better outcomes.”
One idea Orszag supports is the creation of a “backstop fiscal trigger” as part of a deal on the debt ceiling. Such a mechanism would lead to automatic spending cuts and/or revenue increases in the case of congressional inaction on the debt. As Orszag states, “legislative inaction wouldn’t mean failure to address a problem.”
The BPC’s Save-as-you-Go (SAVEGO) proposal is one example of the enforcement mechanism Orszag discusses. Read what New York Times columnist David Brooks had to say about SAVEGO here.
Share
Read Next
Support Research Like This
With your support, BPC can continue to fund important research like this by combining the best ideas from both parties to promote health, security, and opportunity for all Americans.
Give Now